Module dashboards
Module Dashboards shows the figures for each part of the asset process as charts on one page, one module per report family. Use it for a quick picture of a process before you open the screen that owns it.
Before you start
- You need a role that can open Module Dashboards: IT Business Systems or Application Team, IT Hardware Inventory Supervisor, Dedicated IT Warehouse Administrator or CDI Staff, ITD Head and Management, IT Service Governance, IT Service Operations, Infrastructure or Cloud Team, Asset and Logistics Associate, or IT Warehouse Technical Team.
Steps
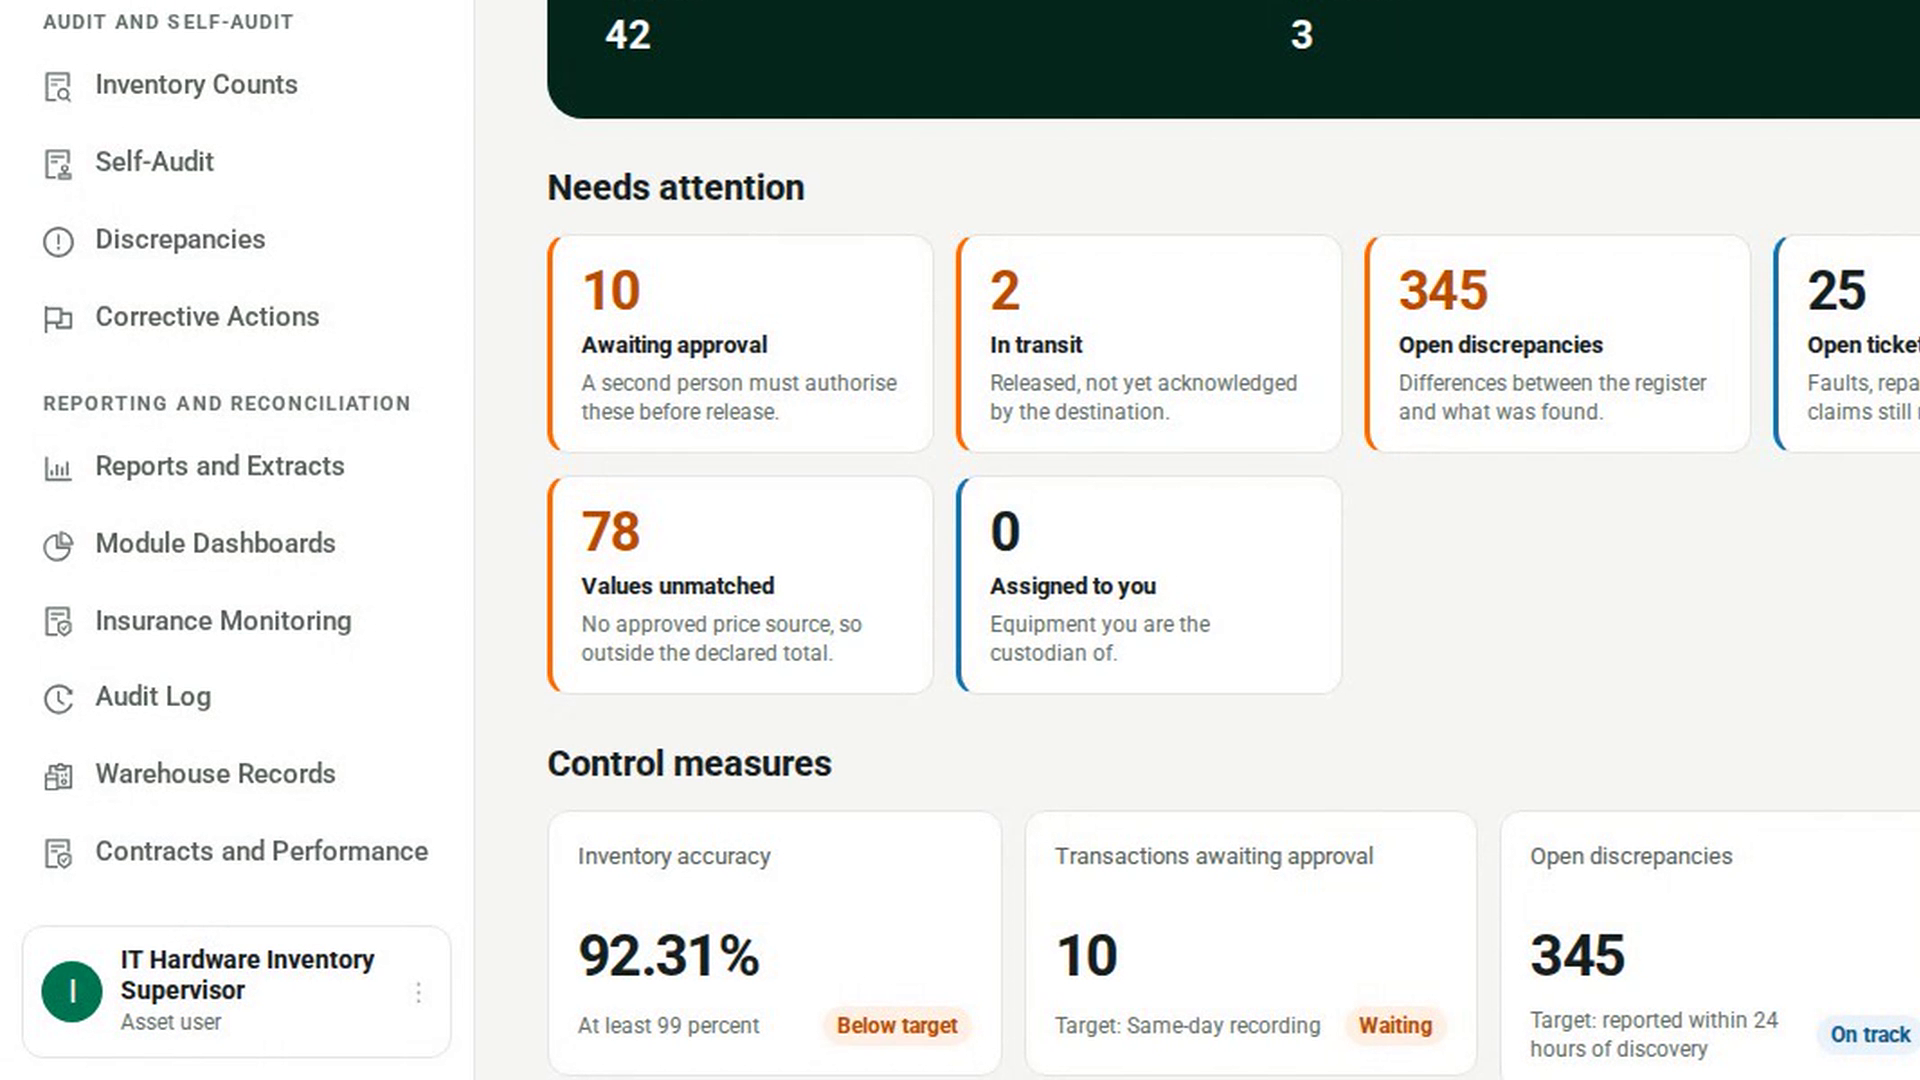
Open Module Dashboards
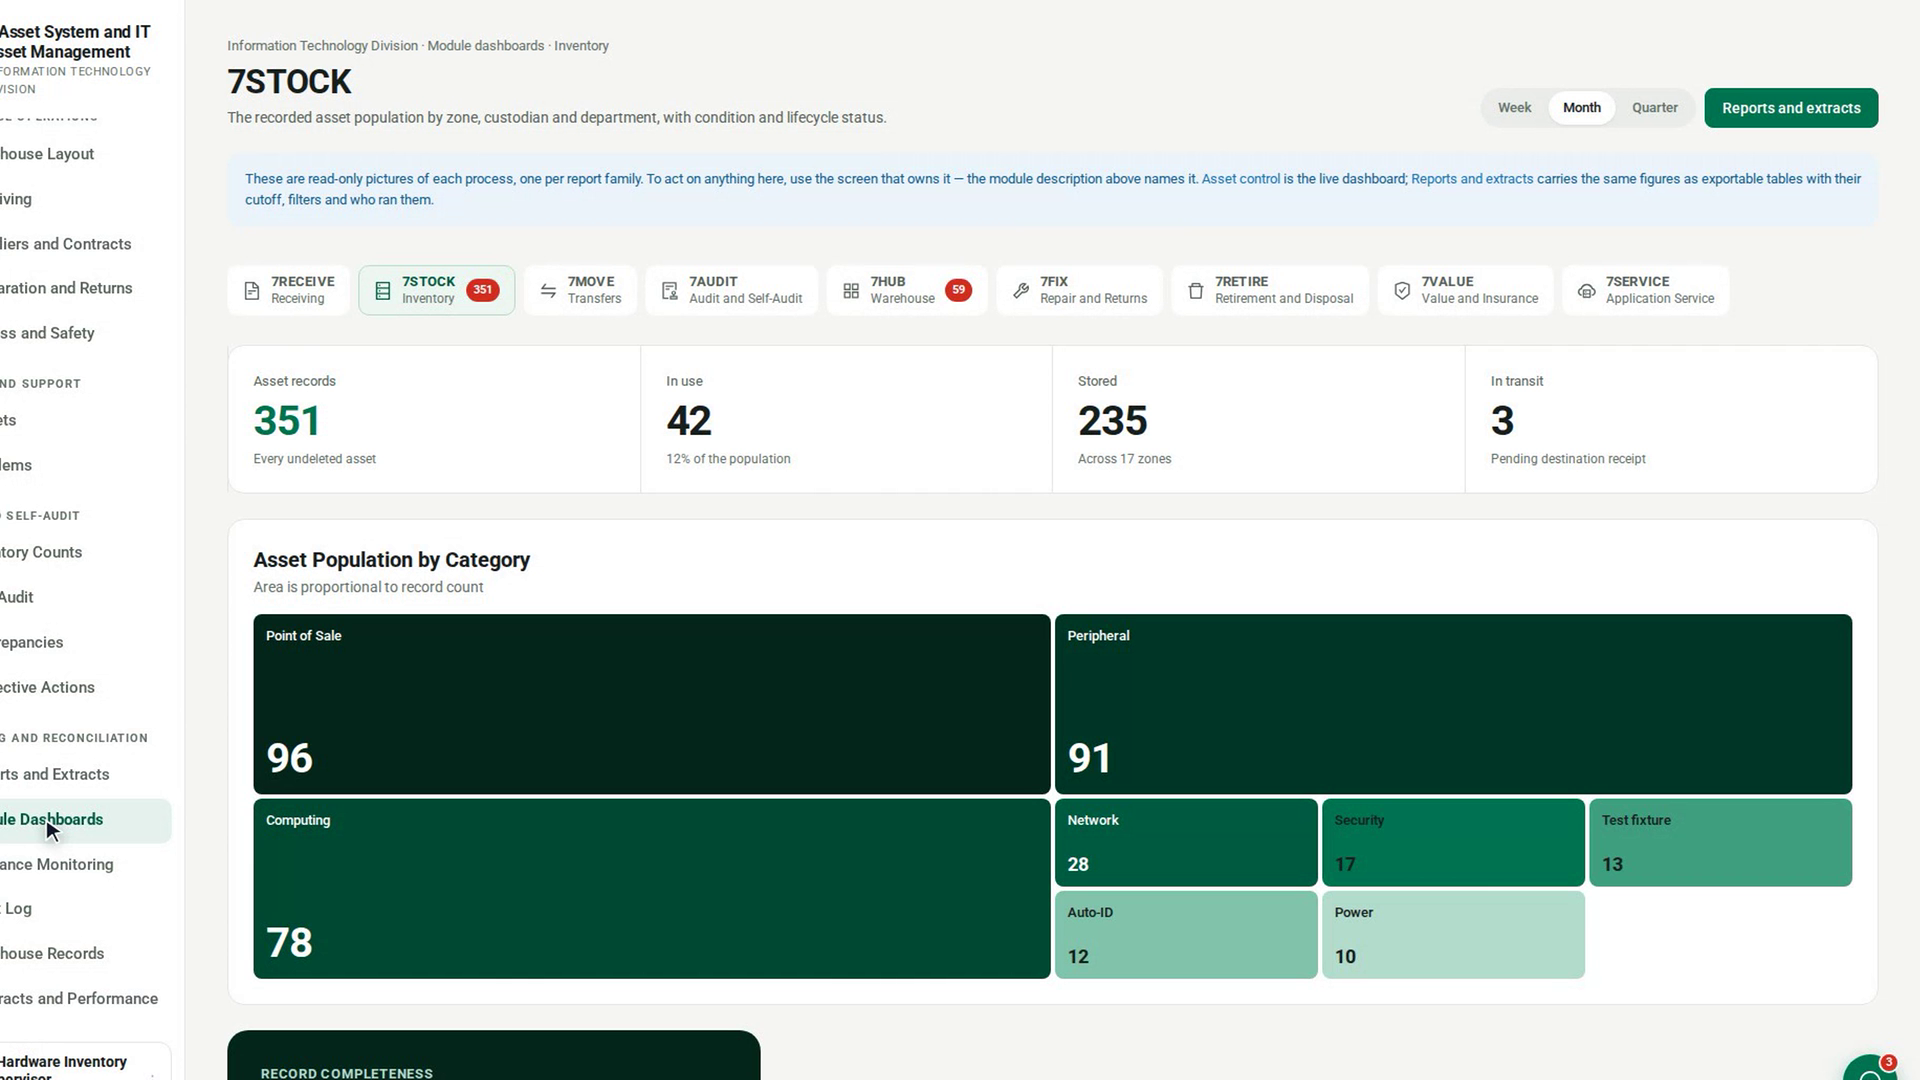
In the sidebar, under Reporting and Reconciliation, select Module Dashboards. The page opens on the Inventory module. A notice under the heading explains that these are read-only pictures of each process.
Choose a module
In the row of modules, select the one you want: Receiving, Inventory, Transfers, Audit and Self-Audit, Warehouse, Repair and Returns, Retirement and Disposal, Value and Insurance or Application Service. A number on a module flags items that need attention. The heading and description change to that module.
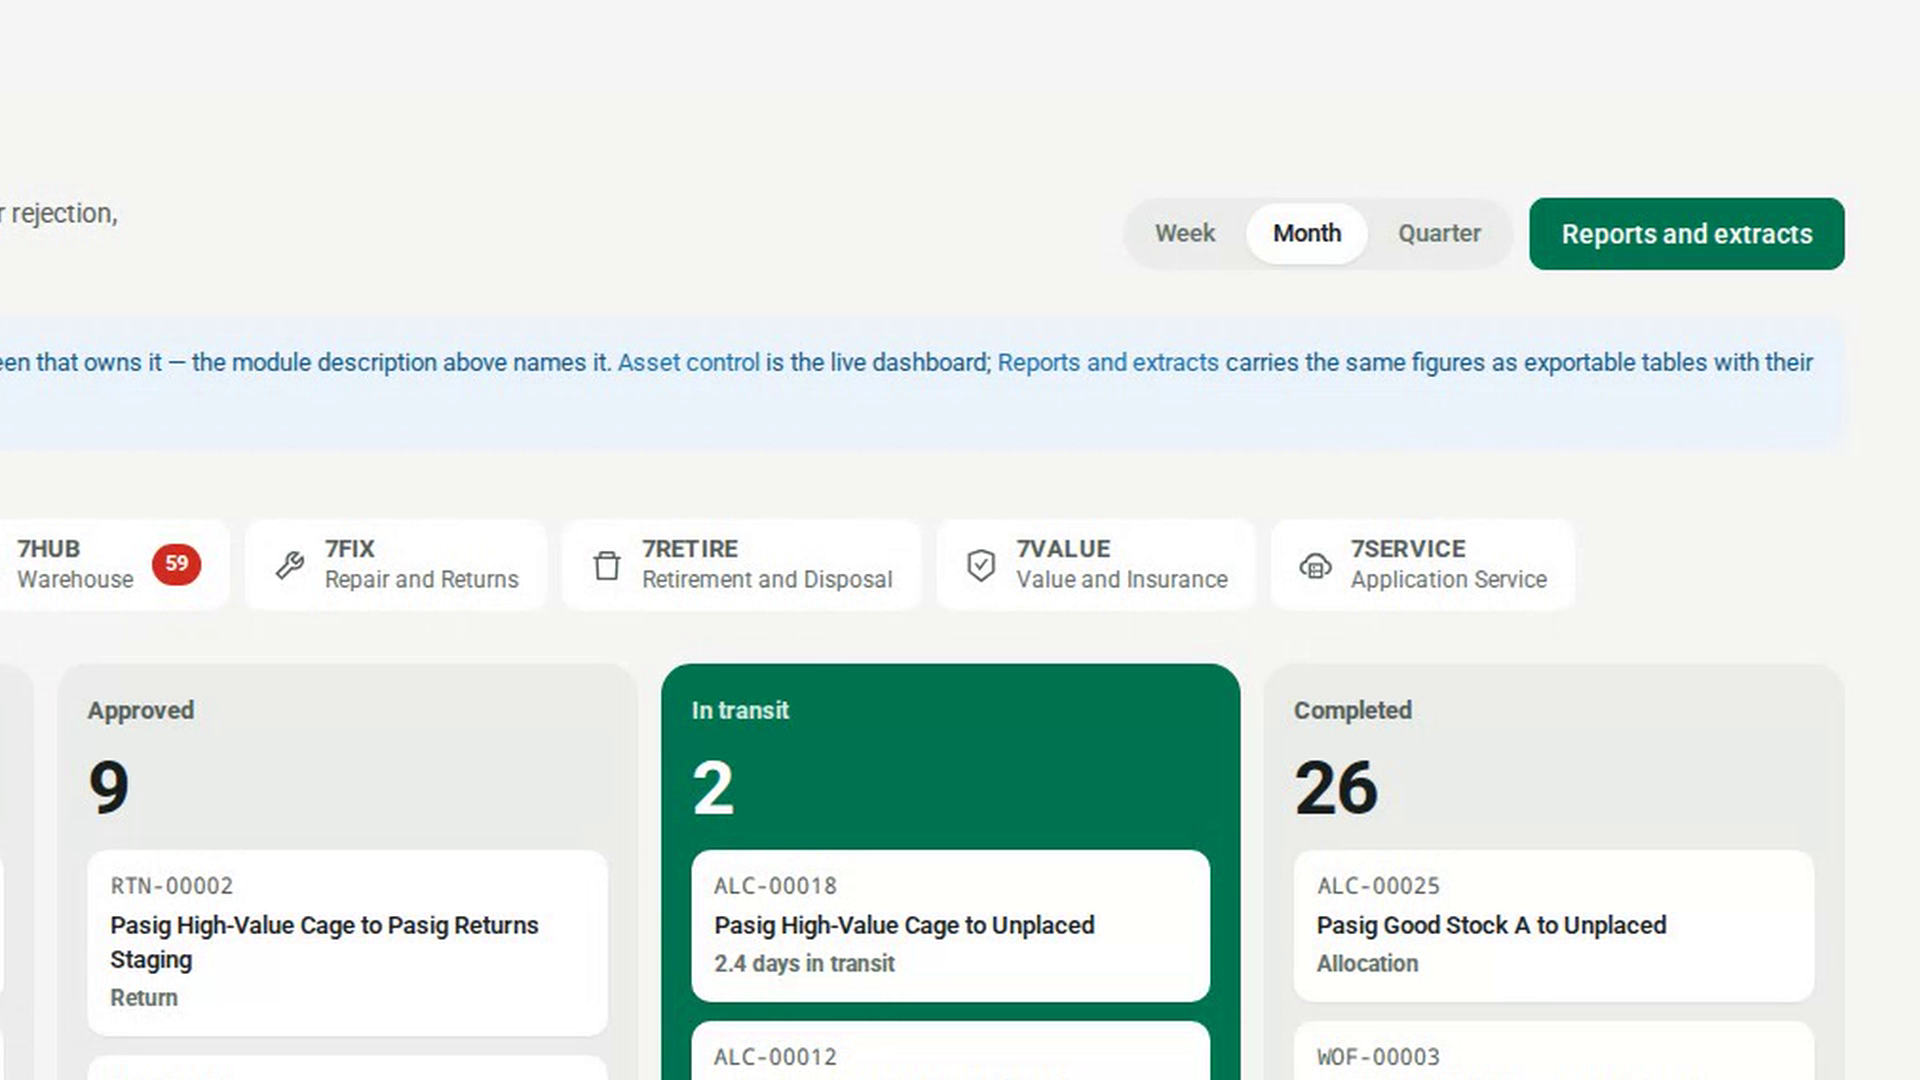
Choose the period
At the top right, select Week, Month or Quarter. The figures that have a date are limited to that period. Figures with no date ignore it.
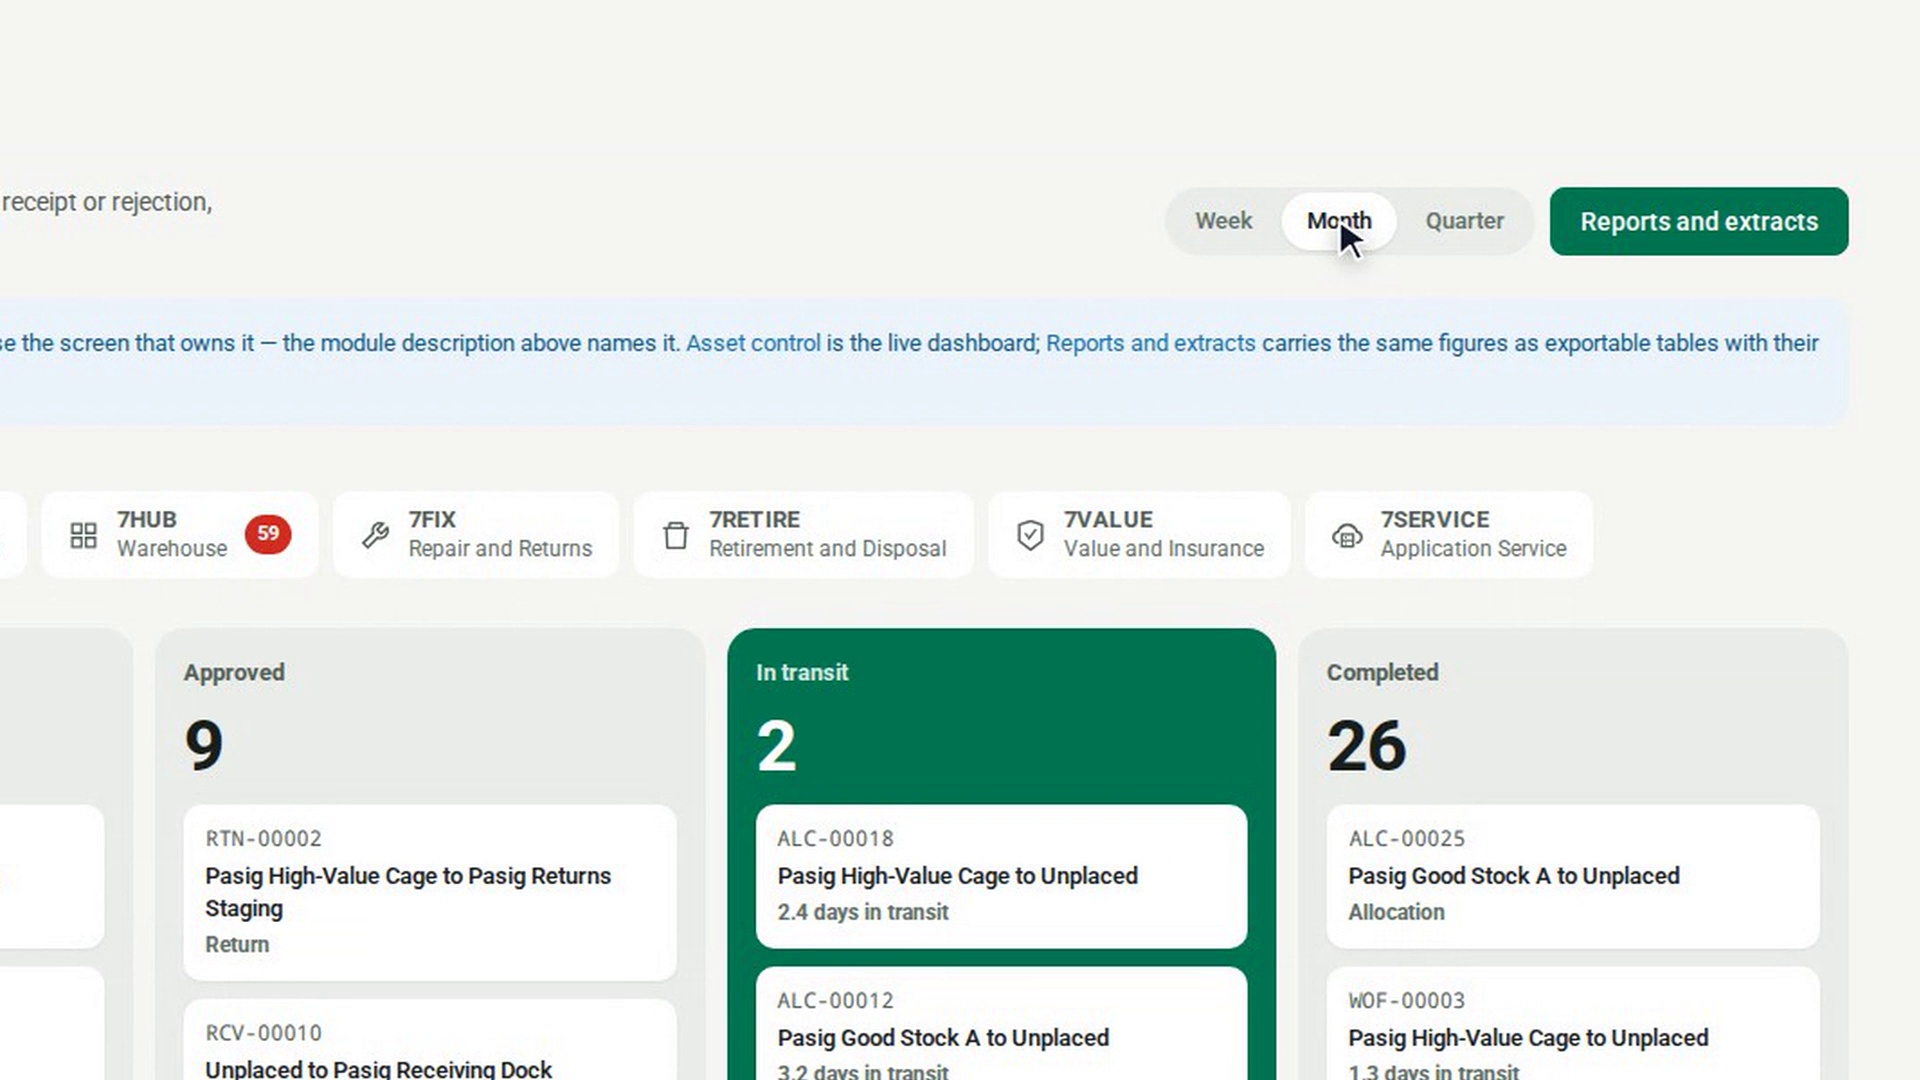
Go to the full report
Select Reports and extracts to open the same figures as tables, with their cutoff, filters and who ran them.
Screenshots
Step 1: Open Module Dashboards
Step 2: Choose a module
Step 3: Choose the period
Step 4: Go to the full report
Watch how
Tip: Nothing on this page changes a record. To act on something you see here, open the screen that owns it. The module description names it.